20 7481 4897")

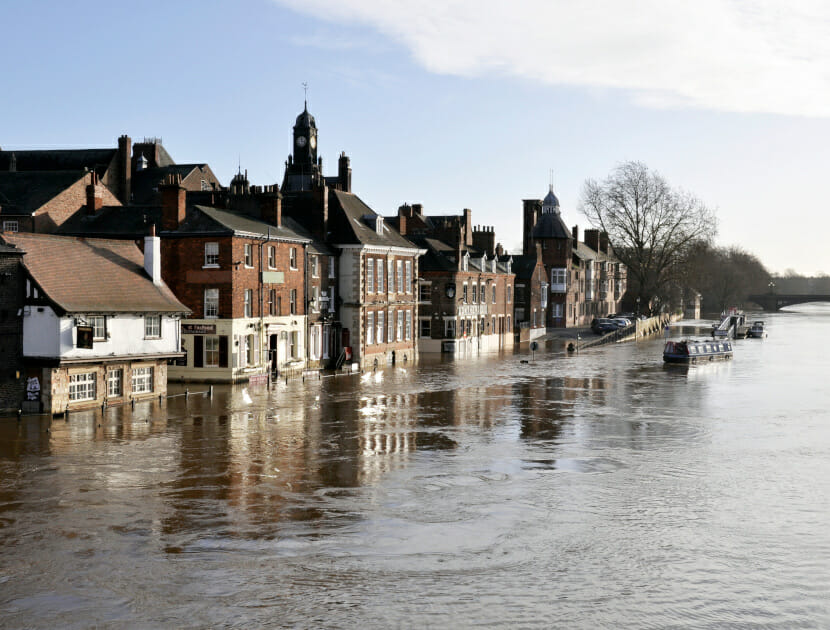

Main image: The Ouse in flood. York.
Approximately one in six UK properties is at risk of flooding, and the annual cost of flood-related insurance claims in the UK averages £200-300 million. This figure is projected to increase with the effects of climate change to £0.5-1.0 billion by the 2080s 1.
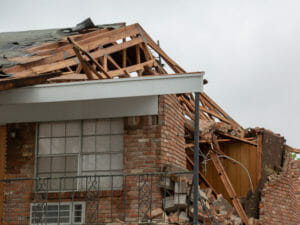
Flooding is often seen as an ‘Act of God’ in the insurance industry, caused by extreme intense or prolonged rainfall. The Association of British Insurers defines an Act of God as “An event that is not the fault of any individual, such as a natural disaster”. In some situations this may be the case, as it is not technically feasible nor economic to prevent all properties from flooding. However there can be other ‘unnatural’ factors that cause or exacerbate flooding, such as:
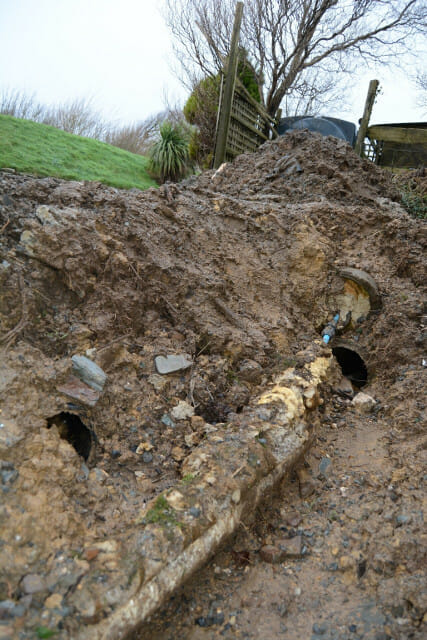
- Inadequate capacity of watercourses or infrastructure such as culverts, flood defences and pumping stations;
- Blockage or failure of infrastructure;
- Inadequate maintenance of watercourses or infrastructure;
- Inappropriate or poorly designed development;
- Land use changes.
In order to quantify the impact of such contributory factors, we must first understand the scale of the underlying flood event.
WE HAVEN’T SEEN A FLOOD LIKE THIS SINCE…
To put the size of a flood into perspective, we need to know how it measures up to other events.
2007 UK flooding “Summer weather wettest on record”2
2012 UK flooding “2012 had the wettest April for 100 years, Met Office says”3
2013-14 UK flooding “UK suffers wettest winter on record”4
2015-16 UK flooding “December 2015 was the wettest month ever recorded in UK”5
2017-18… “Met Office warns Britain is heading for ‘unprecedented’ winter rainfall, with records broken by up to 30pc”6
Clearly we need a consistent metric of assessing flood frequency.
Luckily, the Institute of Hydrology’s Flood Estimation Handbook provides a consistent set of procedures for estimating flood frequency in the UK. Flood frequency estimates are generally expressed as a probability that a flood of a given magnitude, or greater, will occur in a year. This is referred to as the ‘Annual Exceedance Probability’ (AEP) of an event.
ANNUAL EXCEEDANCE PROBABILITY: ROLLING THE DICE
A 1% AEP event has a 1% chance of being exceeded in any year, which is equivalent to an event with an ‘Average Recurrence Interval’ (ARI) or ‘Return Period’ of 100 years. This terminology can however be misinterpreted as meaning that a ‘100-year event’ will only occur once every 100 years. It is important to emphasise that this is the average recurrence interval, but it is possible for more than one such event to occur in quick succession (in a similar way that it is possible to roll the same number on a dice). For this reason it is often preferable to use statistical terminology such as AEP.
Determining an event’s AEP typically involves statistical analysis using many years of recorded rainfall or flow data from nearby or hydrologically similar sites, and rainfall-runoff modelling can also be used. The probability of flood events continues to be refined over time as more data are collected, and also due to the impacts of climate change.
HYDROLOGY: RAINFALL -V- RUNOFF
The UK has one of the densest networks of quality-controlled rain gauges in the world, and rainfall intensity are commonly the best data available to analyse a flood event. We will generally use data from nearby rain gauges to estimate the rainfall intensity at the incident location and/or the catchment upstream. However, there are complicating factors, for example if the flooding was caused by a localised rain storm that bypassed the closest rain gauges. In such cases we can use rain radar or information from rain gauges that are not quality controlled to help to fill in the gaps. However, these data are not always accurate or reliable and so need to be used with skill and care.
It is important to note that rainfall is not what we are ultimately interested in when investigating a flood event. Rather it is the resulting runoff, whether it be directly as surface water flow, or as river flow or elevated groundwater levels. We will use data from local river flow and groundwater level gauges if they are available, however these gauges are spread more thinly across the country than rain gauges. We need to consider a number of site and catchment specific factors that influence the amount and rate of runoff.
TIME-CRITICAL
There are a range of characteristics that influence the volume and rate of runoff from a rainfall event, such as:
- Land use (e.g. rural vs urban);
- Geology and soils (e.g. chalk vs. granite, gravel vs. clay);
- Catchment area, shape and slope;
- Antecedent conditions (i.e. how wet was it prior to the event).
We use these characteristics to work out the ‘critical duration’ rainfall event for the incident location. The critical duration is the duration of rainfall that results in the most significant flooding.
As an example, small urban catchments tend to have short critical durations. They are typically susceptible to surface water flooding from high intensity rainfall events over a shorter duration. This occurs when rain falls at a greater rate than it can infiltrate into the ground or be conveyed away by surface water drainage systems. This was the case in the summer 2012 flooding in Newcastle upon Tyne, when intense rain fell over a localised area over a period of 1-2 hours.
In contrast, larger river catchments and areas susceptible to groundwater flooding tend to have longer critical durations. They are typically susceptible to flooding during prolonged periods of persistent rainfall. This was the case in the 2013-14 winter flooding, when prolonged rainfall through December and January caused flooding to large parts of the UK.
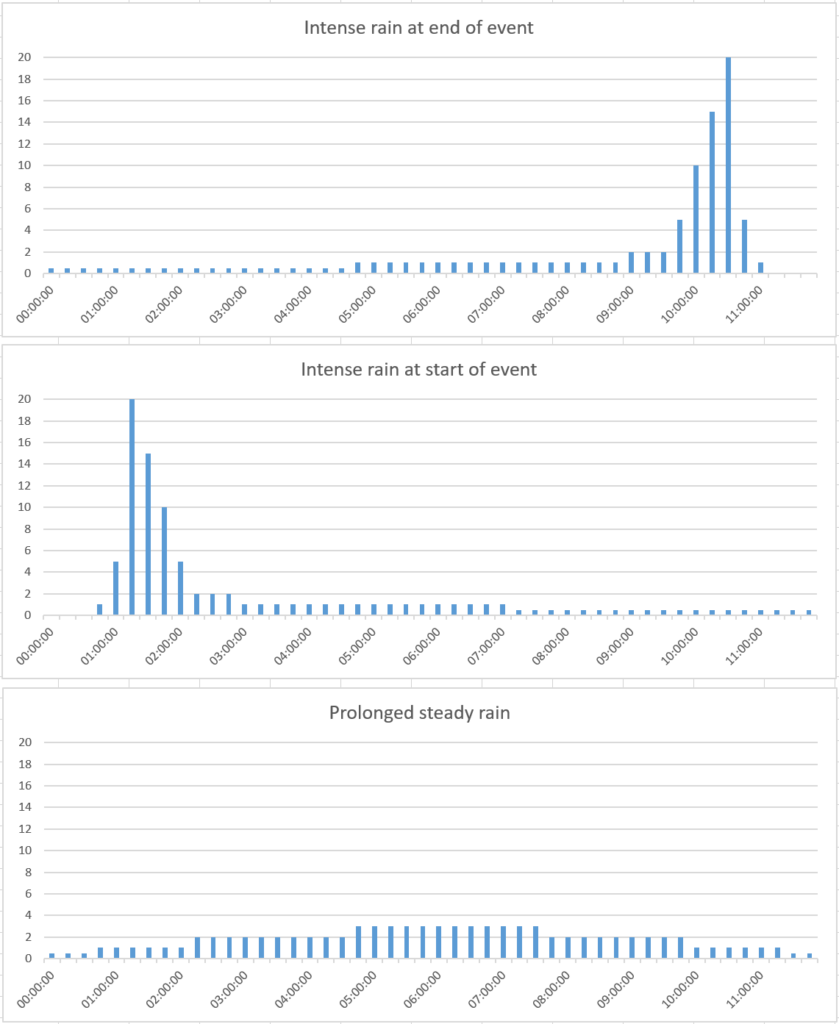
The distribution of rainfall over time varies between individual events, and weather systems that cause persistent rainfall over a long duration rarely produce high intensity, short duration rainfall. Therefore a single storm will often have a different AEP depending on the duration that is considered. Figure 1 below shows three hypothetical events that have the same total rainfall over 12 hours, but a different distribution of rainfall over shorter durations. All three events would have the same AEP over a 12 hour duration. The first and second events would have the same AEP for a 1 hour duration, but this would be different to the 1 hour duration AEP of the last event. It is also important to note that even though the first and second events are ‘mirror images’ of each other, the first event would probably cause more flooding because the intense rain would be falling on ground that was already wet. This highlights an important point: the AEP of a rainfall event is not necessarily the same as the AEP of the resulting runoff / flood event.
HYDRAULIC ANALYSIS AND MODELLING: CALCULATING FLOOD RISK
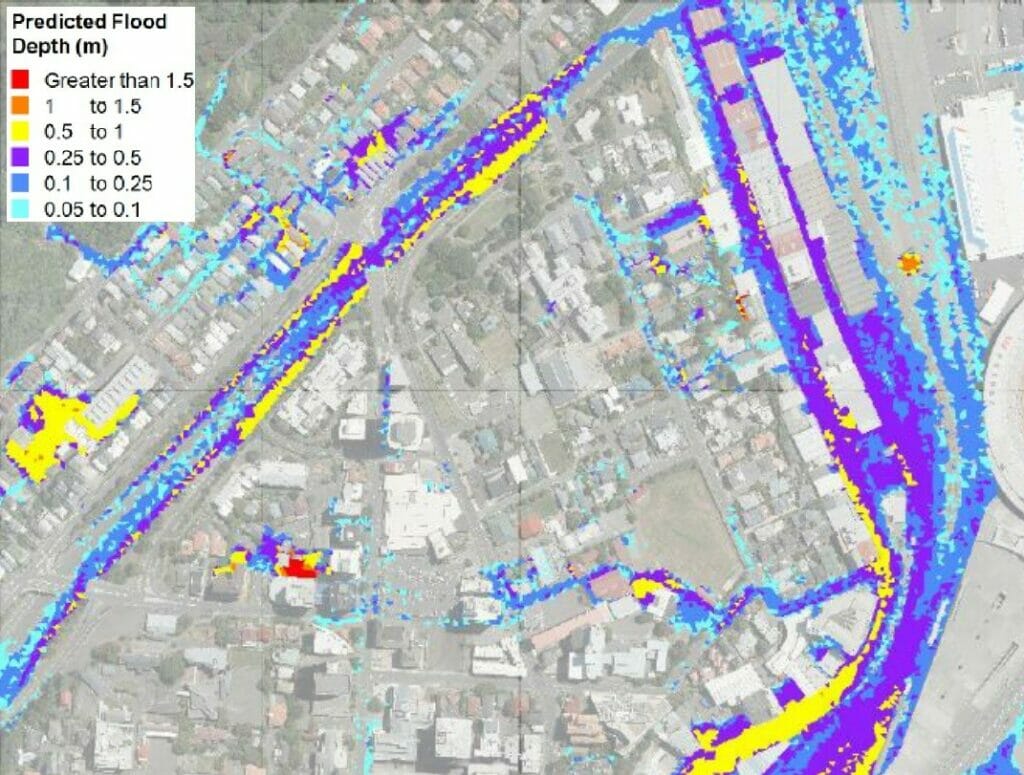
We will typically use hydraulic calculations to establish the capacity of watercourses and infrastructure, and to determine whether the runoff from the event would have resulted in flooding in the absence of other factors such as blockages or infrastructure failure. In more complex situations we can use hydraulic modelling software, which is also useful for testing a range of hypothetical scenarios and for mapping and visualising flood depths and extents (see Figure 2 below). We can also use models to predict the impacts of climate change.
More frequent, more intense storms resulting from climate change will, in the future increase both the impact and likelihood of flooding, putting more people and property at risk. Objective, statistical assessments of flood frequency are a crucial part of quantifying the impact of, or discounting, ‘unnatural’ causative or contributory factors.
Our expert hydrologists, hydraulic modellers and civil engineers have many years of experience investigating and identifying the cause(s) of complex flooding incidents, and advising on measures to reduce future flood risk.
ABOUT THE AUTHOR
Richard Keightley is a Chartered Water and Environmental Manager with a background in flooding investigations, flood risk assessment and management, hydrology and hydraulic modelling. Richard joined Hawkins in 2017 and works closely with the civil engineering team, having previously worked at two major engineering consultancies, a water and drainage utility company and New Zealand’s National Institute of Water and Atmospheric research.
Richard has experience investigating and modelling the risk of flooding from rivers, sea, surface water, groundwater and sewers. He has investigated a wide range of contributory issues such as the maintenance and condition of watercourses, the operation and failure of flow control structures and pumping stations, pipe blockages and collapses, breaches of dams/embankments, land use change and climate change.
1Ramsbottom, D., Sayers, P. and Panzeri, M., Climate Change Risk Assessment for the Floods and Coastal Erosion Sector (January 2012).
2BBC (26 July 2007), http://news.bbc.co.uk/1/hi/uk/6916724.stm
3BBC (30 April 2012), http://www.bbc.co.uk/news/uk-17897982
4The Guardian (20 February 2014), https://www.theguardian.com/environment/2014/feb/2…
5The Guardian (5 January 2016), https://www.theguardian.com/environment/2016/jan/0…
6The Telegraph (24 July 2017), http://www.telegraph.co.uk/news/2017/07/24/britain…